Analysis Overview

An overview of FPVS EEG data processing and response quantification phases.

This guide is currently under development. Please check back later for updates.

The interactive figure below summarizes a typical FPVS EEG processing and response-quantification workflow. Select any step to open its dedicated page.
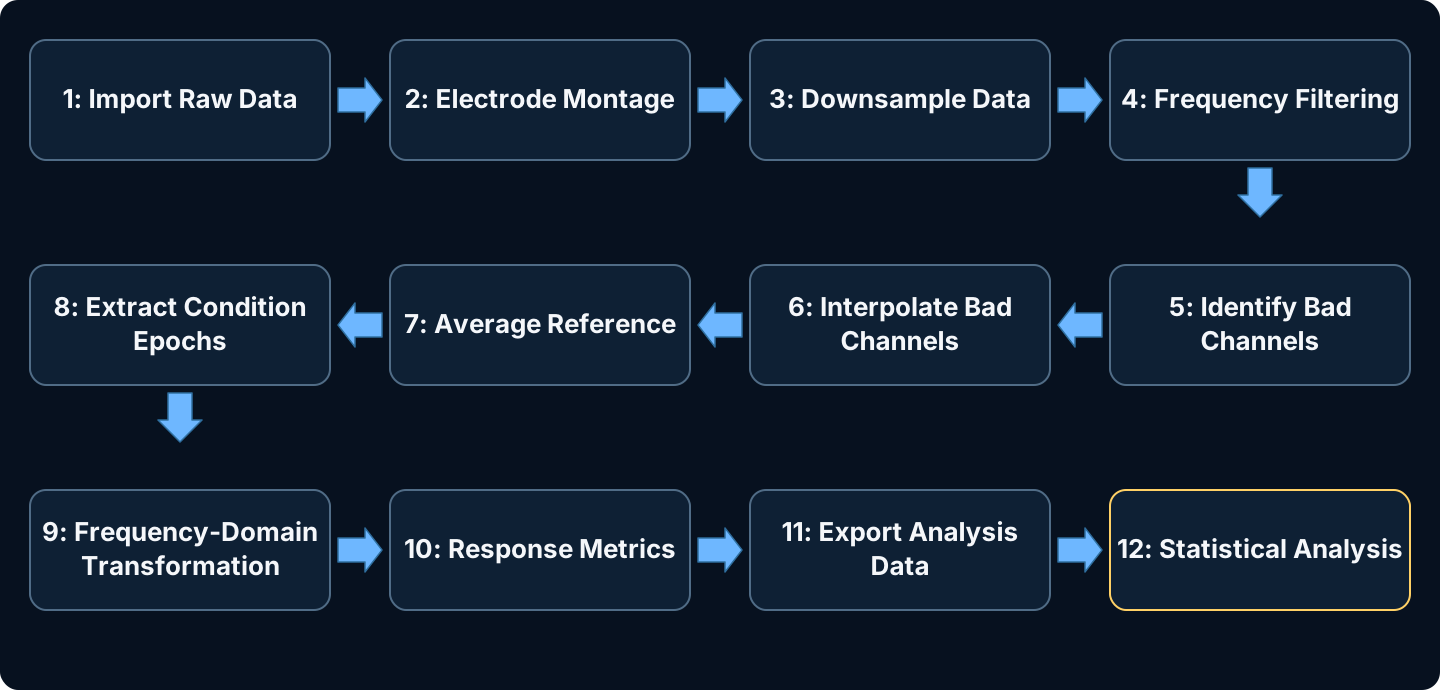
Flowchart showing twelve FPVS EEG analysis steps, from importing raw data and preprocessing channels to frequency-domain analysis, response metrics, spreadsheet output, and statistical analysis.

Example FPVS EEG analysis workflow. Specific preprocessing choices should be adapted to the recording system, study design, and prespecified analysis plan. On smaller screens, scroll the diagram horizontally or view it full size.