Apply High-Pass and Low-Pass Filters
Why filter the recording?
EEG contains the activity we want to measure alongside slow baseline drift, electrical interference and other unwanted signals. A frequency filter reduces selected parts of that mixture. It cannot tell whether a fluctuation came from the brain or from noise: genuine activity in the filtered range will also be weakened. MNE’s filtering guide explains this trade-off.
Two common filters work in opposite directions:
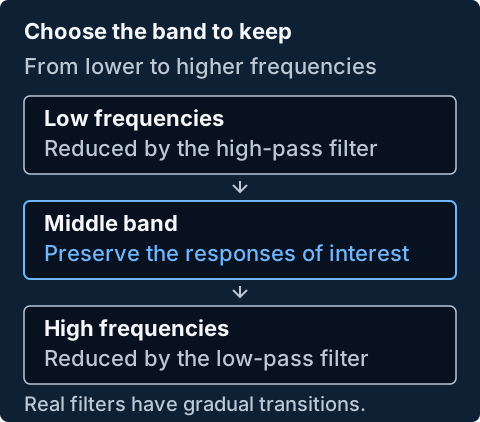
- High-pass: reduces frequencies below a chosen range, helping with slow drift while retaining faster changes.
- Low-pass: reduces frequencies above a chosen range, helping with fast fluctuations while retaining slower changes.
Using both keeps a middle range, often called a band-pass. The boundaries are gradual rather than perfectly sharp. This transition band matters when choosing settings close to a response of interest; EEGLAB’s filtering guide discusses how to leave space for it.
What happens to our data matrix?
In our channel-by-time matrix, each row is one channel’s voltage trace. Filtering recalculates values along the time direction of each EEG row. Unlike downsampling, ordinary filtering keeps the same number of rows and time columns, recording duration and sampling rate. The voltage values change, but their units do not.
Keep trigger codes and other event information separate from this operation: those values mark events rather than EEG voltages. Software such as MNE allows selection of the channels to filter.
Preserve the FPVS responses
Choose settings around the question your experiment is asking. The lowest oddball frequency and the highest harmonic you intend to analyse should sit within the preserved band, with room for the filter’s transitions. For example, a 6 Hz base response analysed through its tenth harmonic extends to 60 Hz. A low-pass filter that attenuates everything above 40 Hz would weaken part of that planned analysis. There is no single cutoff pair that suits every FPVS experiment.
A notch filter targets a narrow range, often around 50 or 60 Hz electrical interference. MNE illustrates this use. The same attenuation also applies to a tagged response at that frequency. In the example above, a 60 Hz notch would affect the tenth harmonic; check for this overlap before choosing a noise-removal method.
Check the result before continuing
Where possible, filter continuous data before cutting it into short epochs, and respect gaps or boundaries between recording segments. Large spikes can spread into neighbouring samples during filtering, so flag major artifacts early. EEGLAB explains these boundary and artifact effects. The anti-alias filter used during downsampling serves a related purpose; include it when checking the recording’s full filtering history.
Compare voltage traces and frequency spectra before and after filtering. Confirm that drift or interference is reduced and the tagged frequencies remain intact. Also inspect recording edges and sharp changes: even a zero-phase filter can spread activity in time, as MNE’s explanation of filtering pitfalls shows. Keep the original recording and record the cutoffs, transition bands, filter type and phase settings so the analysis can be reproduced.